The slide before mine had a number. So did the slide after. Mine had a sentence: "Technical debt is slowing down feature delivery and increasing our risk profile."
The CFO asked the only question that mattered: "How much is it costing us?" I didn't have an answer. Six weeks of paydown work got cut from the roadmap that quarter, not because the debt wasn't real, but because I'd brought judgment into a room built entirely out of numbers.
The meeting where "it's slow" loses
Every other line item in that budget review had a number attached to it. Customer acquisition cost. Churn. Burn multiple. Payback period. Technical debt was the one line still being argued in adjectives: "risky," "brittle," "slowing us down." A CFO who has spent a career being told "trust me" by people who turned out to be wrong will not fund a feeling, and they shouldn't.
The gap isn't that technical debt is unmeasurable. It's that engineers stop measuring it at the point where the argument gets hardest. Stripe's Developer Coefficient survey of more than 1,000 developers and 1,000 C-level executives found that engineers lose 17.3 hours of a 41.1-hour work week, 42 percent of it, to maintenance and bad code, with 13.5 of those hours going specifically to technical debt. That's a real number. It just never survives the trip from the engineering all-hands to the board deck, because nobody converts hours into dollars, and dollars into a line item a CFO already knows how to evaluate.
Stack Overflow's 2025 Developer Survey found technical debt is the single biggest engineering-process frustration, cited by 62 percent of developers, roughly double the second- and third-ranked complaints. CAST Software's 2025 global analysis, built from more than 10 billion lines of code across 17 countries representing 51 percent of world GDP, put the aggregate repair time behind that frustration at 61 billion days. Everyone on the engineering side already agrees the problem is large. The argument that fails is the one that stays qualitative past the point where the audience needs arithmetic.
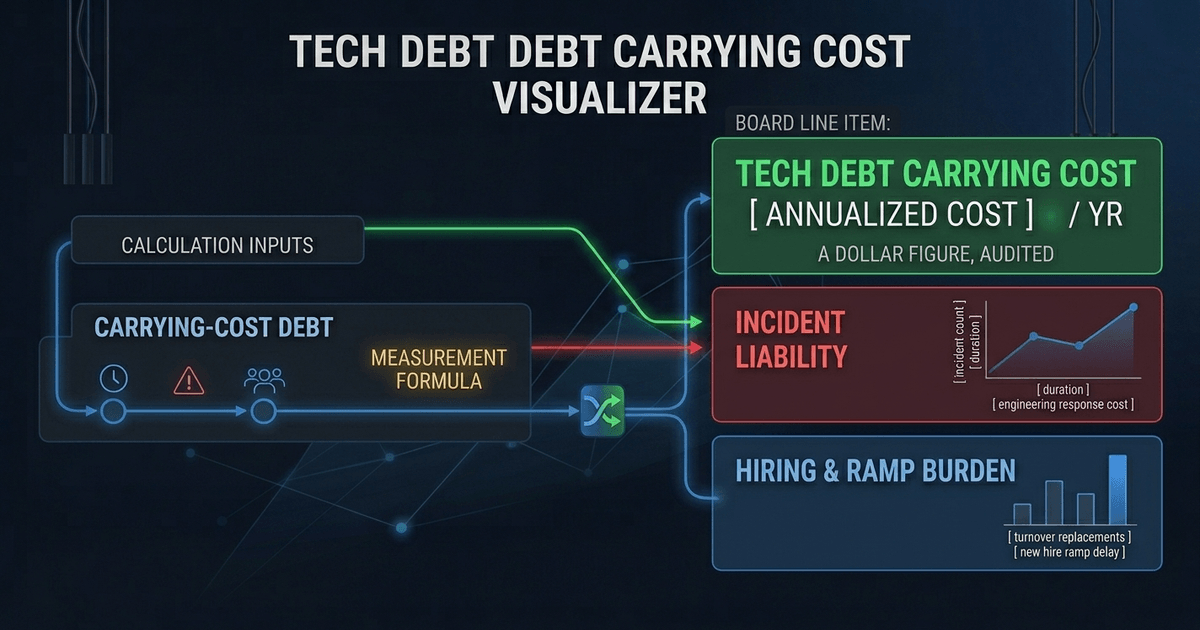
That's the actual distinction this article is about. Felt debt is the judgment every senior engineer carries: this module is dangerous, this pipeline is a house of cards, this dependency should have been replaced two years ago. Carrying-cost debt is the same judgment converted into a number with the same evidentiary weight as CAC or churn: a figure with a formula behind it, sources cited, and a dollar sign in front of it. The rest of this piece is the conversion mechanism, three lines, each independently defensible, summed into one annual carrying cost.
Line one: the velocity tax
The velocity tax is the easiest line to dismiss and the hardest to argue against once it's built correctly, because it doesn't rely on an industry-wide average. It relies on your own team measuring itself.
Velocity Tax = (fully-loaded cost per engineer × engineering headcount)
               × % of engineering time lost to debt-driven friction
The first two variables are payroll data you already have. The third is the one that requires actual measurement: not a guess, not the Stripe industry figure applied blindly to your team, but two sprints of tagging. Every ticket gets one tag: new work, debt-driven friction (the flaky test rerun, the manual deploy step, the workaround for the API that was supposed to be replaced last year), or other. McKinsey's 2020 survey of 50 CIOs at financial-services and technology companies with revenue above $1 billion, still the most commonly cited benchmark on this specific question and one no larger-scale successor has replaced, found that 10 to 20 percent of the technology budget earmarked for new products gets diverted to resolving tech-debt issues, with 30 percent of those CIOs reporting more than 20 percent diverted. That range is your sanity check, not your input.
One methodology note before the numbers: everything from here forward is illustrative, not a benchmark. The formula is what travels, not the dollar signs. A $180,000 fully-loaded engineer is a US mid-market assumption; the same math run against a London team lands closer to £110,000, and a Warsaw or Bangalore team lands lower still. Swap in your own payroll data. The ratios, not the dollar amounts, are what a CFO should hold you to.
Here's the walk-through, using a hypothetical 40-engineer SaaS company with $30 million ARR and an average fully-loaded cost of $180,000 per engineer, numbers a mid-market CTO can swap for their own in under a minute.
Total engineering spend: 40 × $180,000 = $7.2 million. Two sprints of tagging come back at 22 percent of story points landing in debt-driven friction, comfortably inside McKinsey's reported range.
Velocity Tax = $7.2M × 22% = $1,584,000 a year.
Line two: the incident cost
Not every production incident traces back to technical debt. The ones that do are usually the ones with a name everyone on the team already knows: the deploy that always needs a manual rollback step, the service with no ownership since the person who wrote it left, the integration held together by a retry loop nobody trusts.
Incident Cost = (debt-attributable incidents per year)
                × (avg fully-loaded cost per incident)
DORA's research gives the benchmark for the first variable. The 2025 State of DevOps report tightened its top-tier change failure rate benchmark to 0 to 2 percent, and only 16.7 percent of surveyed teams hit that bar. DORA's tier language has shifted across report years, so treat "top-tier" as this report's own bar rather than a fixed industry label, but the 0-to-2-percent figure and the 16.7 percent result are well corroborated. Most teams run well above both. The same report found that AI adoption doesn't fix this gap, it widens it: for teams with a solid foundation, AI is an accelerant; for teams carrying technical debt, AI amplifies the dysfunction that was already there. Debt doesn't just slow a team down. It sets the ceiling on how much faster anything else can make them.
Debt doesn't just slow a team down. It sets the ceiling on how much faster anything else, including AI tooling, can make them.
The incident-cost line isn't just a historical tally. It's a forward-looking constraint on every other initiative competing for the same budget, AI adoption included.
The obvious objection: if AI-assisted development lets a 40-engineer team do the work of 60, doesn't the carrying cost shrink along with the headcount? No, it concentrates. A leaner team still covers the same brittle queuing system and the same undocumented integrations, with fewer people absorbing the friction per capita. That's the mechanism behind the DORA finding above: AI accelerates teams with clean foundations and amplifies dysfunction in teams without them. A smaller roster doesn't retire the debt. It raises the cost per engineer left holding it.
Back to the walk-through: the 40-engineer team ships 400 production deploys a year and runs a 12 percent change failure rate, six times DORA's top-tier benchmark. That's 48 incidents a year. Postmortems from the last four quarters attribute 40 percent of those specifically to technical debt rather than process gaps or third-party outages, roughly 19 incidents a year.
Cost per incident should come from your own postmortems, not an industry headline. Atlassian's downtime-cost primer traces its enterprise-scale numbers to two older but still widely cited studies: Gartner's 2014 estimate of $5,600 a minute, and an Avaya report from the same year putting the range at $2,300 to $9,000 a minute depending on company size. Both skew toward much larger companies than a 40-engineer team. Atlassian's own recommended rate for a small or mid-market business, $427 a minute, is the more honest input here. At a 45-minute average incident duration plus roughly $500 in engineering response time (three engineers, two hours, at this team's loaded hourly rate), that's $427 × 45 minutes + $500, or $19,734 per incident.
Incident Cost = 19 × $19,734 = $374,946 a year.
Line three: the hiring drag
The hiring drag is the line CFOs underestimate most, because it doesn't show up as a single expense. It shows up as two: engineers who leave because of the codebase, and new engineers who take longer to become productive inside it.
Hiring Drag = (debt-attributable departures per year × replacement cost per departure)
              + (debt-attributable departures × extended ramp cost per new hire)
SHRM puts the general cost of replacing an employee at 50 to 200 percent of salary, and specifically flags specialized technical roles, software engineers among them, at the higher end: 100 to 150 percent once recruiting, onboarding, and lost productivity are counted. LinkedIn's 2025 Talent Trends report puts the average cost of replacing a mid-senior software engineer at $43,700, a figure that captures recruiting spend but not the full productivity gap SHRM's percentage-of-salary framing includes.
In the walk-through, exit interviews over the past year identify three departures out of forty engineers where "the codebase" or "we never get to fix anything" was named as a primary reason for leaving, a number that should come from actual exit-interview data, not a guess. Each of those roles carried a $150,000 base salary. At 125 percent of salary, the SHRM midpoint for specialized technical roles, that's $187,500 per departure in replacement cost.
Debt has a second cost on top of that: it slows down the people who replace them. A new hire ramping into a debt-heavy codebase, one without clear ownership boundaries, current documentation, or a test suite anyone trusts, takes longer to reach full productivity than one dropped into a clean system. This team estimates six extra weeks of ramp time per hire, priced at the org's $180,000 average fully-loaded cost divided across a 52-week year, $3,462 a week: another $20,769 per departure.
Hiring Drag = 3 × ($187,500 + $20,769) = $624,807 a year.
Summing the three lines into one number
Three lines, each built from the company's own data and checked against a published external range, sum to one figure: the annual carrying cost of technical debt for this team.
| Line | Annual cost |
|---|---|
| Velocity tax | $1,584,000 |
| Incident cost | $374,946 |
| Hiring drag | $624,807 |
| Total carrying cost | $2,583,753 |
Against $7.2 million in total engineering spend, that's 35.9 percent, a figure the formula didn't target and wasn't tuned to hit. It landed inside McKinsey's reported 20-to-40-percent range because the three lines it's built from, time, incidents, and people, are the same three places CIOs say the money actually leaks.
A fair skeptic will point out that one hypothetical example landing inside a wide published range proves the range is wide, not that the method is right, and that's a reasonable objection. The credibility isn't in the walkthrough's total. It's in the fact that each of the three lines was built from a formula the reader can rerun with their own postmortems, payroll, and exit interviews, numbers a board can audit, not numbers a consultant asserts. If your own tagging exercise comes back at 8 percent instead of 22, the framework produces a smaller carrying cost, and that's the model working, not failing.
Sixty-one percent of that total, the velocity tax, never appears on an incident report or an exit interview. It's the part of the carrying cost most boards never see, because nothing broke and nobody left. It just cost $1.58 million to keep shipping at the reduced pace debt imposes, quietly, every quarter, with no line item and no meeting where anyone asked about it.
What the number buys you in the room
In Q1, I asked for six weeks of engineering time to replace a queuing system held together by three cron jobs and a Slack alert that paged whoever happened to be online. The ask got cut in the first pass. No number attached, just "this is risky," the same sentence that lost the meeting at the start of this piece. Eleven weeks later, that queuing system dropped roughly 40,000 orders during a Black Friday traffic spike. Refunds, expedited shipping, and the two weeks of emergency engineering time to rebuild it under pressure came to about $310,000. The same six weeks of work got approved within a day of that incident.
The number isn't there to prove engineers were right all along. It's there so the decision gets made before the incident, not after it, using the same instrument the CFO uses to evaluate every other line competing for that budget. A carrying-cost figure doesn't guarantee the paydown work gets funded. Plenty of legitimate, well-quantified asks lose to a bigger number elsewhere in the business, and that's a fair outcome. What the number removes is the asymmetry: the paydown ask sitting in a different evidentiary category than every other line on the slide, judged by feel while everything around it is judged by arithmetic.
The paydown ask shouldn't sit in a different evidentiary category than every other line on the slide, judged by feel while everything around it is judged by arithmetic.
That queuing system's replacement wasn't a harder engineering problem in November than it was in January. It was the same six weeks of work. The only thing that changed was who was doing the pricing.
Sources
- Stripe - The Developer Coefficient - survey of 1,000+ developers and 1,000+ C-level executives across five countries on time lost to technical debt and bad code.
- McKinsey - Tech debt: Reclaiming tech equity (2020) - survey of 50 CIOs at financial-services and technology companies above $1B revenue on budget diversion and tech-debt scale.
- DORA - State of DevOps Report 2025 - AI adoption amplifies existing engineering foundations, including unresolved technical debt.
- CAST Software - Coding in the Red: The State of Global Technical Debt (2025) - analysis of over 10 billion lines of code across 17 countries representing 51% of world GDP.
- Stack Overflow - 2025 Developer Survey - technical debt ranked the top engineering-process frustration, cited by 62% of developers.
- SHRM - The Myth of Replaceability - cost of replacing an employee ranges 50-200% of salary, with specialized technical roles at the higher end.
- Atlassian - Calculating the Cost of Downtime - compiles per-minute downtime cost benchmarks from Gartner (2014) and Avaya (2014) at enterprise scale, plus Atlassian's own $427/minute small and mid-market recommendation.
- LinkedIn - Talent Trends 2025 - average cost to replace a mid-senior software engineer.