To follow along: install PageSpeed Saver for Chrome. It downloads the full Lighthouse JSON from any URL in one click, no API key required. The JSON is the actual diagnostic instrument - not the score.
43% of websites fail at least one Core Web Vital on mobile. Most of those failures are not slow servers or bad architecture. They are loading order mistakes, malformed files, and CSS patterns that silently delay the browser's largest visible element from qualifying as a render candidate - none of which show up in code review or visual QA.
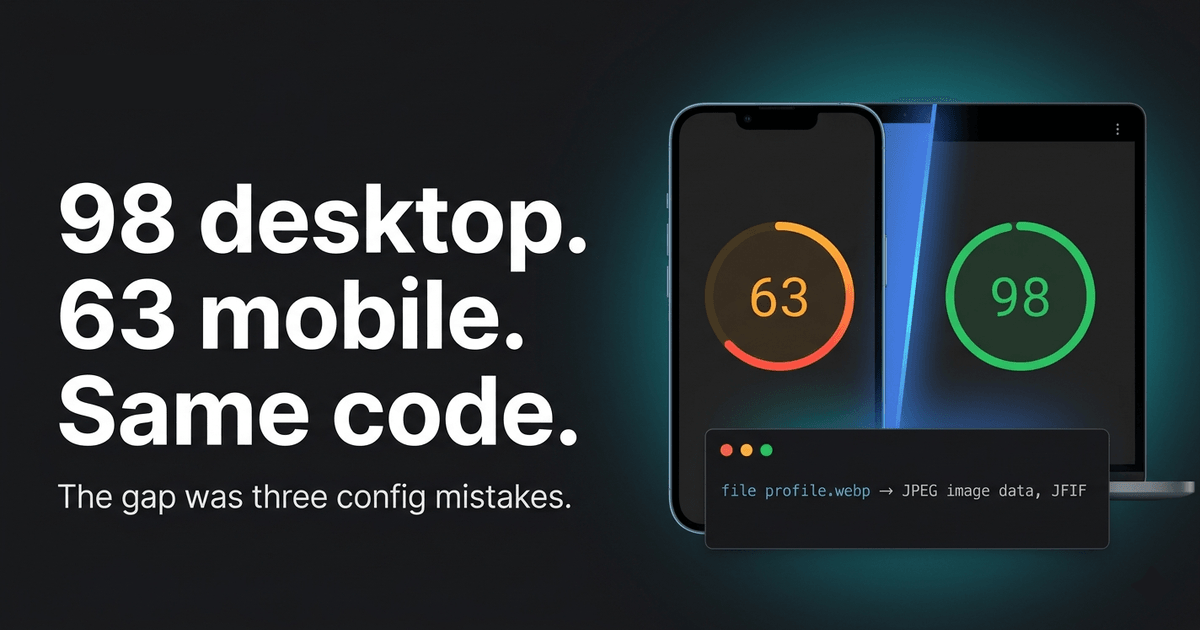
One site I audited recently scored 98/100 on desktop and 63/100 on mobile. Same server. Same codebase. Same files deployed to the same CDN. The 35-point gap came from three fixable issues that appeared in under 30 seconds when I ran the audit - and had been invisible to every other quality check.
This article documents the playbook: what PageSpeed Insights is actually measuring, the three issue categories that surface most consistently across audits, and how to prioritize the output so you fix what moves the score first.
Worked example: All before/after scores, metric values, and code samples in this article are drawn from three consecutive PageSpeed Insights audits of andreinita.co - a static Astro 6 portfolio deployed on Cloudflare Pages, audited using the PageSpeed Saver Chrome extension. Round 1 baseline: early 2026. Round 2: May 19, 2026. Round 3 baseline: June 1, 2026. The Round 3 projected score (90-93) is an estimate based on Lighthouse savings calculations, not a measured result. All scores are Lighthouse lab data, not CrUX field data. The diagnostic categories and fix patterns apply to any comparable site; the specific numbers will differ on yours.
Part I: What PageSpeed Actually Measures
Lab data vs field data
PageSpeed Insights shows two things most engineers treat as one.
Lab data is the Lighthouse score: a synthetic simulation run under controlled conditions - a specific network throttle, a specific CPU multiplier. Reproducible, consistent, actionable. This is where the 0-100 number comes from.
Field data is the Chrome UX Report (CrUX): real performance measurements from Chrome users who have visited your URL over the past 28 rolling days. This is what Google uses for search ranking. It appears in the "Discover what your real users are experiencing" panel in PSI - the section most engineers scroll past.
The two can diverge significantly. A site can score 90 in the lab and still fail CrUX thresholds if real users are on constrained devices or slow connections. A low-traffic site may have no CrUX data at all, in which case Google falls back to lab data for ranking decisions.
Your optimization lever is the lab score. Watching field data confirms the improvement reached real users, typically within 28 days of a deploy.
Scoring weights
Lighthouse does not weight all metrics equally. As of Lighthouse 10, LCP and TBT together account for 55% of the overall score. This is why fixing them moves the number faster than anything else - and why generic advice like "compress your images" often disappoints. A 5KB image savings barely touches TBT. If TBT is 720ms, thumbnail compression will not register.
| Metric | What it measures | Good threshold | Score weight |
|---|---|---|---|
| LCP | When the largest visible element is painted | ≤2.5s | 25% |
| TBT | Total main-thread blocking time | ≤200ms | 30% |
| CLS | Cumulative layout shift | ≤0.1 | 25% |
| Speed Index | Visual completeness over time | ≤3.4s | 10% |
| FCP | First Contentful Paint | ≤1.8s | 10% |
TTI was removed from Lighthouse 10+ scoring. INP replaced FID as a Core Web Vital in March 2024 - it appears in field data but TBT remains its lab proxy. You can plug your own metric values into the Lighthouse Score Calculator to see exactly how each number maps to a final score before and after a fix.
The JSON as your backlog
Open the PageSpeed Saver export. Find the audits object. Every flagged issue has an estimatedSavings value in milliseconds. Sort descending. That is your work queue - pre-prioritized by impact, no judgment calls required.
The opportunities array surfaces the biggest wins. diagnostics covers structural issues with no direct ms estimate but real performance cost at load. Start with opportunities. Work top to bottom.
What the raw JSON entry looks like
Each opportunity in the exported JSON follows this structure. The field to sort on is details.overallSavingsMs:
// audits["render-blocking-resources"]{ "id": "render-blocking-resources", "title": "Eliminate render-blocking resources", "score": 0.5, "details": { "type": "opportunity", "overallSavingsMs": 310, "items": [ { "url": "https://fonts.googleapis.com/css2?...", "totalBytes": 4512, "wastedMs": 310 } ] }}To build your prioritized backlog programmatically: filter Object.values(json.audits) for entries where details?.type === 'opportunity', then sort descending by details.overallSavingsMs. The PageSpeed Saver extension also renders this sorted in the UI, no scripting required.
Part II: The Three Issue Categories
Browser rendering primer for the backend developer: browsers process pages on a main thread that handles HTML parsing, JavaScript execution, style calculation, layout, and paint - anything that blocks it delays everything visible on screen. A separate compositor thread runs independently and handles a small set of CSS properties (transform and opacity) without touching the main thread, which is why animating only those properties never causes jank even under JavaScript load. A third parallel mechanism, the preload scanner, runs ahead of the main HTML parser to discover resource URLs early - font files, images, scripts - so the browser can start fetching them before the parser has fully processed the page. The fixes in this section target each of these layers.
Category 1: Render Blockers
Baseline on the site audited: score 63, TBT 720ms, LCP 1.7s desktop
Three issues surfaced in a single audit pass. Each one blocked rendering in a different way.
Serial font loading chains
A fonts.css stylesheet was loaded via <link rel="stylesheet">. Inside it: two sequential @import url() directives pointing at Google Fonts. Browsers discover @import rules one at a time - download the stylesheet, parse it, find the first import, fetch that, and only then discover the second. A serial waterfall requiring three network round trips before any font renders.
No new dependencies. Replace the single stylesheet link with two direct <link> tags using the media="print" onload pattern:
<!-- Before: serial @import waterfall via fonts.css --><link rel="stylesheet" href="/assets/fonts.css">
<!-- After: parallel, non-blocking --><link rel="stylesheet"  href="https://fonts.googleapis.com/css2?family=Roboto:wght@400;500;700&display=swap"  media="print" onload="this.media='all'"><link rel="stylesheet"  href="https://fonts.googleapis.com/css2?family=Google+Sans:wght@400;500;700&display=swap"  media="print" onload="this.media='all'"><noscript>  <link rel="stylesheet"    href="https://fonts.googleapis.com/css2?family=Roboto:wght@400;500;700&display=swap"></noscript>
Text renders immediately with a system fallback. Fonts swap in when they arrive. The noscript block handles JS-disabled environments. Measured savings on the site audited: 310ms render block eliminated, critical path depth reduced by 1,691ms.
Why media="print" specifically: browsers do not block rendering to download print stylesheets, since they are only needed when the user prints the page. Setting media="print" tricks the browser into fetching the stylesheet in the background without blocking. The onload handler then switches it to media="all" once it has arrived, applying the styles. It is a deliberate exploit of this browser behaviour, not a mistake.
Forced reflows
A scroll-event function read getBoundingClientRect() immediately after writing navIndicator.style.*. Reading layout properties after a style mutation forces the browser to recalculate layout synchronously before the read can return - a forced reflow. This ran on every scroll event.
// Triggers a forced reflow: write then readnavIndicator.style.opacity = '1';const rect = activeLink.getBoundingClientRect(); // synchronous layout recalc
// Fix: read everything first, write everything afterconst navRect = navContainer.getBoundingClientRect();const linkRect = activeLink.getBoundingClientRect();navIndicator.style.opacity  = '1';navIndicator.style.left     = (linkRect.left - navRect.left) + 'px';navIndicator.style.width    = linkRect.width + 'px';
The broader fix: cache all section.offsetTop values at page load into an array. On scroll, compare against the cache - no DOM reads inside the handler. Measured savings: 502ms of main-thread blocking time removed.
Compositor-unsafe animations
A hero animation transitioned clip-path and listed it in will-change: opacity, transform, filter, clip-path. Two problems compound: clip-path transitions cannot run on the GPU compositor thread, so the browser repaints on the main thread every animation frame; and listing clip-path in will-change promotes the element to its own GPU layer, consuming GPU memory without enabling compositor-thread execution.
Fix: remove clip-path from both transition and will-change. opacity and transform are the only CSS properties that run fully on the compositor thread. The visual result - a fade-in and upward reveal - is identical at real-world frame rates.
Score after fixing all three: 63 → 76 mobile, 97 desktop.
Category 2: Image Format Failures
Starting point: 76 mobile, 97 desktop - a 21-point gap
The PageSpeed JSON audits.modern-image-formats entry flagged the hero profile image as the primary LCP resource. Serving size on desktop: 35KB. Every other image on the site: 7-10KB. One command to diagnose:
file public/assets/profile.webp# profile.webp: JPEG image data, JFIF standard 1.01The .webp extension was false. The image conversion script had written Buffer.from('WEBP_PLACEHOLDER') to disk - a placeholder that was never replaced with an actual conversion. The file was a renamed JPEG serving at 35KB to every desktop visitor, while the mobile version (which used a correctly generated 7KB WebP at a different srcset descriptor) loaded fine.
This is what LCP sub-part 3 looks like in practice. According to web.dev/articles/optimize-lcp, LCP breaks into four sequential phases: TTFB, resource load delay, resource load duration, and element render delay. This image was burning time in phase 3 - the resource itself was too large. The LCP gap between desktop (1.1s) and mobile (4.6s) was almost entirely this one file.
Fix: wire sharp in the conversion script, regenerate the image (~9KB real WebP vs 35KB JPEG), add a preload hint, and add fetchpriority="high" directly on the <img>:
<!-- Warm up both Google Fonts origins - most sites preconnect to only one --><link rel="preconnect" href="https://fonts.googleapis.com"><link rel="preconnect" href="https://fonts.gstatic.com" crossorigin>
<!-- LCP preload with responsive image descriptors --><link rel="preload" as="image" href="/assets/profile.webp" imagesrcset="/assets/profile-400.webp 400w, /assets/profile.webp 750w" imagesizes="(max-width: 768px) 200px, 260px"><!-- fetchpriority on the img element itself --><img src="/assets/profile.webp" srcset="/assets/profile-400.webp 400w, /assets/profile.webp 750w" sizes="(max-width: 768px) 200px, 260px" fetchpriority="high" alt="Profile photo" width="260" height="260">fetchpriority="high" signals to the browser's preload scanner - the parallel thread described in the primer above that discovers resources ahead of the HTML parser - to raise this image above competing resources. Per web.dev/articles/fetch-priority, adding it to the Google Flights hero image moved LCP from 2.6s to 1.9s. Supported in Chrome 102+, Safari 17.2+, Firefox 132+. One HTML attribute, no build changes.
A note on the second preconnect: fonts.gstatic.com is where the actual font files live - a separate origin from fonts.googleapis.com where the CSS lives. Both need preconnect for the TLS handshake to be warm. Most tutorials show one. Missing the second costs approximately 150ms per font load on a 4G connection.
Bonus fix found in the same pass: a tag page was loading 75KB of Tailwind CDN via a synchronous <script> tag - render-blocking on every /blog/tags/* URL. Replacing 68 utility classes with scoped CSS eliminated the blocking script entirely.
Score after fixes: 76 → 80 mobile, 97 → 98 desktop.
Category 3: JS-Gated Above-Fold Content
Starting point: 80 mobile, 98 desktop
The PageSpeed JSON showed two long tasks at 3,397ms and 3,489ms. The LCP element - a text paragraph near the top of the page - did not appear as an LCP candidate until 4.2s into the load.
The opacity:0 LCP candidacy exclusion
The LCP element had opacity: 0 in CSS. A JavaScript class toggle, fired after DOMContentLoaded, made it visible with a staggered transition delay.
The mechanism matters here. Per the Largest Contentful Paint specification: "elements with an opacity of 0, that are invisible to the user" are explicitly excluded from LCP candidate consideration. The browser does paint the element - it exists as a transparent composited layer. But the LCP algorithm does not register it as a candidate until opacity is non-zero. On the site audited, that delay was 2,294ms - the full span from HTML parse to when JavaScript ran and changed the class.
For statically generated or server-rendered sites, this is a category error. The server already knows what content is above the fold. JavaScript is not needed to decide what is visible. The fix is a static class in the server-rendered HTML:
<!-- Before: opacity:0 in CSS until DOMContentLoaded + JS class toggle --><p class="credibility hero-animate">
<!-- After: visible from first byte, CSS handles the stagger timing --><p class="credibility hero-animate in-view" style="animation-delay: 0.24s">
The staggered reveal becomes a CSS animation-delay instead of a JS-injected transitionDelay. The element qualifies as an LCP candidate from the first byte the browser receives. Estimated savings: 800-1,200ms LCP.
This fix requires server-side or static rendering - the server must know what content is above the fold at build time. For client-side SPAs (React, Vue, Angular), the equivalent fix is initializing the visible state synchronously before the first render rather than in a lifecycle hook that runs after mount.
The GTM defer blocking chain
Per the HTML specification, defer scripts execute after HTML parsing but before DOMContentLoaded fires. Every defer script in the document joins that queue, and DOMContentLoaded waits for all of them to complete.
On the site audited, a Google Tag Manager container script used defer. The main application script also used defer. GTM produced two long tasks at 3.4s. The application script could not run until GTM finished - both were queued behind the same DOMContentLoaded gate.
<!-- Before: joins defer queue, blocks DOMContentLoaded --><script defer src="https://www.googletagmanager.com/gtag/js?id=G-XXXXXXX"></script>
<!-- After: executes immediately when downloaded, no queue dependency --><script async src="https://www.googletagmanager.com/gtag/js?id=G-XXXXXXX"></script>
The inline dataLayer push already buffers events before GTM loads - this is the standard GTM initialization pattern and it works correctly with async.
One caveat: async removes execution order guarantees. If any other script depends on a global variable GTM injects into the window object, switching to async can break that dependency. Audit your script load order before making this change.
Interaction-triggered third-party loading
A HubSpot chat script loaded on a hard-coded 3-second setTimeout, producing two long tasks at 5.5s - inside the Speed Index measurement window. The fix is the facade pattern: load the script only on first user interaction, with a maximum fallback delay:
var thirdPartyLoaded = false;function loadThirdParty() { if (thirdPartyLoaded) return; thirdPartyLoaded = true; var s = document.createElement('script'); s.async = true; s.src = '//js-eu1.hs-scripts.com/XXXXXXXX.js'; document.body.appendChild(s);}['mousemove', 'keydown', 'touchstart', 'scroll'].forEach(function(e) { window.addEventListener(e, loadThirdParty, { once: true, passive: true });});setTimeout(loadThirdParty, 5000); // 5s max fallbackThe script fires on first interaction or after 5 seconds - whichever comes first. Analytics and chat still fire. The long tasks move past the Speed Index measurement window. Apply the same pattern to any third-party widget that does not need to be available before the user has moved a mouse.
Expected score after these fixes: 80 → 90-93 mobile. Projection methodology: individual estimatedSavingsMs values from each audit were fed into the Lighthouse Score Calculator against the Round 3 baseline metrics to estimate the resulting score. LCP savings of ~1,200ms and TBT reduction from GTM async together account for most of the projected gain.
Part III: What to Fix First
The opportunity array in the PageSpeed JSON sorts by estimated savings. Start there. These categories consistently deliver the best effort-to-impact ratio:
| Fix category | LCP savings | TBT savings | Effort |
|---|---|---|---|
| Static above-fold classes (SSG/SSR) | 800-1,200ms | - | 1 HTML attribute |
Third-party scripts: defer → async | - | 500-2,000ms | 1 word |
Verify image format with file command | 300-800ms | - | 1 command |
LCP <link rel="preload"> hint | 300-800ms | - | 1 line |
fetchpriority="high" on LCP image | 200-700ms | - | 1 attribute |
preconnect to all third-party origins | 150-300ms | - | 2 lines |
| Read/write batching in scroll handlers | - | 100-500ms | Refactor |
| Interaction-triggered third-party loading | - | 500ms SI | ~15 lines |
| Remove compositor-unsafe animations | - | 50-200ms | CSS edit |
Responsive srcset with correct per-viewport sizes | 15-50KB | - | HTML attributes |
Three additions that consistently get skipped:
fetchpriority="high": One attribute. Google Flights saw LCP drop from 2.6s to 1.9s after adding it to their hero image. Supported in all modern browsers. According to Google's documentation, only 17% of pages with an identifiable LCP image currently use it.
preconnect to every third-party origin: Not just the first one. Google Fonts loads CSS from fonts.googleapis.com and font files from fonts.gstatic.com - two origins, two TLS handshakes. GTM, analytics scripts, and chat widgets each need their own preconnect. Every missing one costs approximately 150ms on a 4G connection.
Lighthouse CI with a performance budget: Every fix documented here can be silently regressed by a future analytics tag or a dependency update. A budget.json file in CI makes performance a build constraint rather than a periodic audit:
{ "budgets": [{ "path": "/*", "timings": [ { "metric": "largest-contentful-paint", "budget": 2500 }, { "metric": "total-blocking-time", "budget": 200 } ] }]}Build fails if LCP exceeds 2.5s or TBT exceeds 200ms. This is the difference between a one-time audit and a maintained standard.
The highest-impact PageSpeed fixes are almost never found in sprint planning. They are found by running the audit and sorting the JSON output by estimated savings. The tool has already done the prioritization work. The audit takes 30 seconds. Most sites are 3 to 5 hours of fixes away from passing every Core Web Vital threshold.
Sources
- HTTP Archive Web Almanac 2024 - Performance - 43% of websites pass all Core Web Vitals on mobile; 59% achieve good LCP on mobile
- Lighthouse 10 Performance Scoring - LCP 25%, TBT 30%, CLS 25%, FCP 10%, Speed Index 10%
- Lighthouse Score Calculator - interactive tool mapping metric values to final scores
- Largest Contentful Paint specification - LCP candidate algorithm; opacity:0 exclusion
- Optimize Largest Contentful Paint - LCP four sub-parts: TTFB, load delay, load duration, element render delay
- Fetch Priority API - Google Flights LCP case study; fetchpriority="high" browser support
- HTML specification - defer and async script attributes - authoritative source for DOMContentLoaded blocking behavior
- Google Search Central - Core Web Vitals - confirmed ranking factor
Working through the challenges in this post? I help engineering leaders and CTOs navigate complex technical decisions and scale high-performing teams. Schedule a consultation →